Who configures what?
To avoid confusion, here’s a quick split of responsibilities:
Client side
On your infrastructure, the main configuration for observability lives in thecomponents/infra/grafana/otelcol-config.yaml file.
In this file, you define the collector’s behavior:
- Processors: batching, memory limits, filtering, obfuscation, sampling, etc.
- Exporters: for example, dual routing to Prometheus
- API key authentication secrets
After editing this file, you must restart the stack with
make down && make up for changes to take effect.Lerian side
On Lerian’s managed infrastructure, the observability stack is centrally configured and operated. This includes:- Central Collector
- Prometheus
- Loki
- Tempo
- Grafana
These components are preconfigured and maintained by Lerian. You don’t edit them directly.
How the data flows
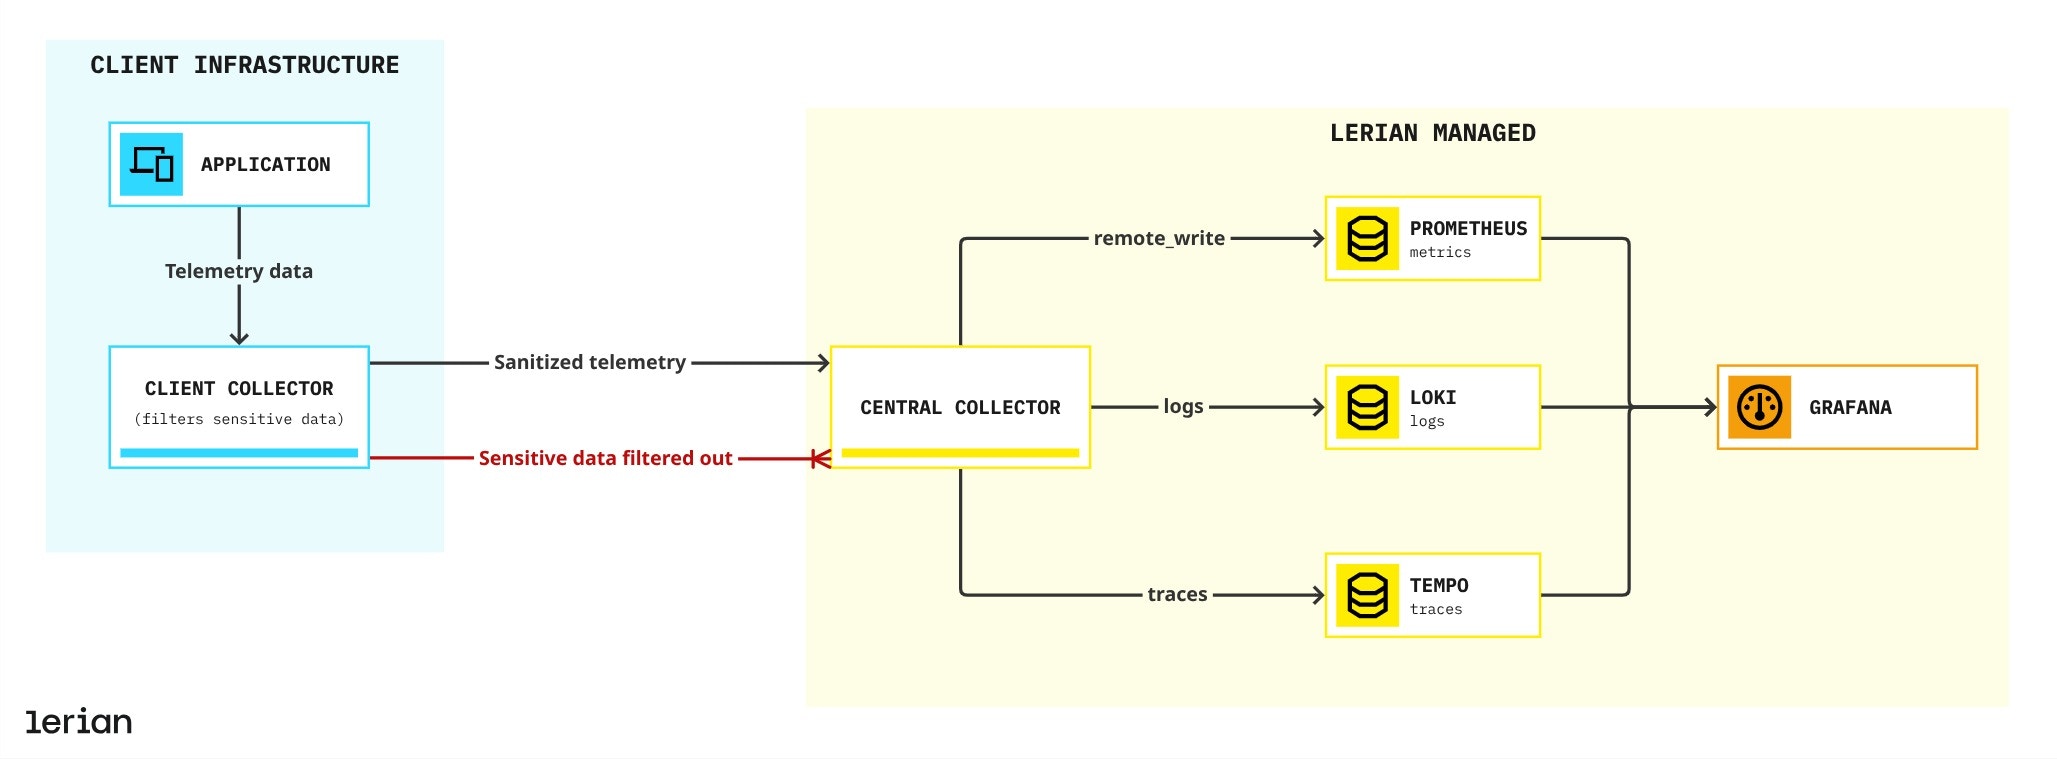
Telemetry data originates in your application and flows through a Client Collector, powered by OpenTelemetry. Running in your environment, this collector enriches the data and securely forwards it to a Central Collector managed by Lerian. From there, it’s routed to three specialized backends:
- Prometheus for metrics
- Loki for logs
- Tempo for traces
Stack components
Together, these components form a complete observability pipeline: flexible on your side, consistent and secure on Lerian’s side, and fully based on OpenTelemetry standards.
Client Collector
The Client Collector is a lightweight OpenTelemetry Collector that runs close to your application, either as a DaemonSet or a Deployment. It enriches telemetry with Kubernetes metadata and your tenant identifier (client_id), then routes the data to the Central Collector.
It matters because it reduces load on the central pipeline, enables source-level filtering, and attaches crucial metadata such as k8s.pod.name. Installation is managed via Helm and Terraform, making it easy to integrate into your infrastructure.
Central Collector
The Central Collector is a centralized OpenTelemetry Collector deployment that receives telemetry from all clients. It performs global processing, enforces multi-tenancy, and exports signals to the appropriate storage backends.The Central Collector is fully managed by Lerian. You don’t configure or modify it directly.
Prometheus
Prometheus is optimized for storing and querying numerical time-series data. The Central Collector pushes metrics usingremote_write.
Loki
Loki stores logs using label-based indexing, making it fast and cost-effective. Logs are sent from the Central Collector to theloki-write service.
Tempo
Tempo stores full distributed traces and integrates tightly with Prometheus and Loki through Grafana.Grafana
Grafana is your single pane of glass. It connects to Prometheus, Loki, and Tempo, enabling you to correlate metrics, logs, and traces in one place.You can pivot between metrics, logs, and traces directly inside Grafana to speed up troubleshooting.
Embedded Collector
You can enable the Client Collector as a dependency of your Midaz application with a single configuration flag:
Editing the Client Collector
When you need to customize behavior (obfuscation, filtering, sampling, etc.), you will:
-
Edit
components/infra/grafana/otelcol-config.yaml. -
Add or adjust the
processorsorexportersblocks. -
Restart the stack:
Client Collector Processors
In the OpenTelemetry Collector, processors are the core of data manipulation. They run sequentially to enrich, filter, sample, and transform telemetry data before exporting it to the backends. Below is the list of processors configured in the Lerian Client Collector, their purpose, and how to configure them.
Where to configure: add each block under
processors: in otelcol-config.yaml.- What it is: Groups multiple telemetry signals (metrics, logs, or traces) into batches before sending them to the next stage.
- Why it matters: Improves compression efficiency, reduces network requests, and enhances overall pipeline performance.
- Configuration:
- What it is: Monitors the collector’s memory usage and drops data if it approaches a defined threshold.
- Why it matters: Prevents the collector from being OOMKilled by Kubernetes.
- Configuration:
- What it is: Generates metrics directly from trace data.
- Why it matters: Produces “RED” metrics (Rate, Errors, Duration) automatically.
- Configuration:
- What it is: Removes sensitive span attributes using regex.
- Why it matters: Keeps identifiers but strips headers, bodies, or other sensitive request data.
- Configuration:
- What it is: A sampling strategy applied after spans are received.
- Why it matters: Keeps only high-value traces (errors, specific clients) and reduces storage costs.
- Configuration:
- What it is: Filters out node-level metrics.
- Why it matters: Reduces noise and focuses on app-level telemetry.
- Configuration:
- What it is: Keeps only metrics from
midazandmidaz-plugins. - Why it matters: Eliminates irrelevant Kubernetes workloads.
- Configuration:
- What it is: Adds Kubernetes metadata to telemetry.
- Why it matters: Enables richer context in Grafana queries.
- Configuration:
- What it is: Inserts or updates
client.idin telemetry. - Why it matters: Critical for multi-tenancy.
- Configuration:
- What it is: Removes log body content.
- Why it matters: Prevents sensitive or PII data from persisting in logs.
- Configuration:
- What it is: Obfuscates selected attributes.
- Why it matters: Protects sensitive values (like
legalDocumentoraccountAlias) before data leaves your cluster. - Configuration (
otelcol-config.yaml):
- Customizing the fields:
- Defaults:
legalDocument,accountAlias - Add or remove fields as needed
- Restart required:
make down && make up
- Defaults:
In short
| Processor | Data type | Function | Benefit |
|---|---|---|---|
| batch | Metrics, Logs, Traces | Groups telemetry before export | Improves compression and network use |
| memory_limiter | Metrics, Logs, Traces | Drops data when memory limit is near | Prevents OOMKilled |
| spanmetrics | Traces → Metrics | Creates RED metrics | Immediate performance insights |
| transform/remove_sensitive_attributes | Traces | Strips sensitive span attrs | Keeps IDs, removes secrets |
| tail_sampling | Traces | Smart sampling of traces | Lower storage, focus on errors/targets |
| filter/drop_node_metrics | Metrics | Excludes noisy node-level data | Cleaner dataset |
| filter/include_midaz_namespaces | Metrics | Keeps only Midaz namespaces | Removes irrelevant metrics |
| k8sattributes | Metrics, Logs, Traces | Adds K8s metadata | Richer Grafana context |
| resource/add_client_id | All signals | Tags telemetry with client ID | Enables multi-tenancy |
| transform/remove_log_body | Logs | Clears log body | Avoids storing PII |
| transform/obfuscate_attributes | All signals | Masks chosen fields | Ensures sensitive data never leaves |
Protecting sensitive data
Midaz treats the Client Collector as a telemetry firewall. All filtering, sampling, and transformation rules are defined in your configuration file (
components/infra/grafana/otelcol-config.yaml).
Client vs Lerian responsibilities in the observability pipeline
Sensitive values such as request bodies, legal documents, or account aliases never reach Lerian’s Central Collector.
- Client Collector (you configure): Runs in your cluster. Apply processors such as
transform/remove_sensitive_attributes,transform/remove_log_body, andtransform/obfuscate_attributes. - Central Collector (Lerian managed): Receives only the filtered, sanitized telemetry streams and routes them to Prometheus, Loki, and Tempo.
You decide what’s sensitive in
otelcol-config.yaml. Lerian only sees sanitized telemetry.Telemetry flow
Here’s what happens when telemetry is enabled:
- Application starts and detects OpenTelemetry configuration.
- Telemetry is exported to the local Client Collector.
- Client Collector enriches data with Kubernetes metadata and your
client_id. - Processors enrich, filter, and transform the data.
- Data is forwarded to the Central Collector.
- Central Collector processes and routes data:
- Metrics → Prometheus
- Logs → Loki
- Traces → Tempo
- Grafana lets you query it all, correlating across signals.
Authenticating collector requests
To ensure data security and integrity, all telemetry sent from your cluster to Lerian’s platform must be authenticated using a secure API key.
How to set it up
- Create the Kubernetes Secret to store your API token:
- Reference the secret in your Helm values file to inject it as an environment variable:
- Telemetry is securely sent to Lerian’s telemetry endpoint over HTTPS, with the API key included in the headers.
This key must remain private. If compromised, contact Lerian support immediately to rotate the token.
Data encryption in transit
All telemetry data, including metrics, logs, and traces, is transmitted from your environment to Lerian’s observability platform using HTTPS with TLS encryption. This means:
- The communication between the Client Collector and the Central Collector is fully encrypted.
- Data in transit is protected against interception, tampering, or unauthorized access.
- Even if network traffic is inspected, the contents remain unreadable without the proper cryptographic keys.
We enforce encrypted transport by default. No data is accepted over insecure channels.
Dual routing
Need to keep a copy of your metrics internally? You can configure the Client Collector to send telemetry to multiple destinations.
Example
This setup is ideal for local monitoring without disrupting the standard flow to Lerian’s observability stack.
Glossary
DaemonSet
DaemonSet
A Kubernetes workload type that ensures a Pod runs on every (or selected) node in a cluster. Used for deploying the Client Collector, so that it can collect node-level data like Kubelet metrics.
Deployment
Deployment
A Kubernetes workload that manages replicas of a Pod. Used for the Central Collector and other platform services.
Exporter
Exporter
Sends telemetry data from the Collector to one or more backends (e.g., Prometheus for metrics, Loki for logs, Tempo for traces).
Grafana
Grafana
An open-source visualization layer. Grafana connects to Prometheus, Loki, and Tempo to provide a unified interface for querying and exploring metrics, logs, and traces.
Loki
Loki
Our backend for logs. Loki indexes metadata labels rather than full log content, making it fast and cost-efficient for high-volume use cases.
Multi-tenancy
Multi-tenancy
An architectural approach where a single platform serves multiple clients (tenants). In Midaz, telemetry data is tagged with a
client_id to ensure isolation and traceability across tenants.Observability
Observability
The ability to understand a system’s internal state by analyzing its external outputs. In practice, it means collecting and analyzing metrics, logs, and traces to monitor performance and troubleshoot issues.
OpenTelemetry (OTel)
OpenTelemetry (OTel)
An open-source framework with tools, APIs, and SDKs for instrumenting, generating, collecting, and exporting telemetry data — metrics, logs, and traces.
OTel Collector
OTel Collector
A standalone service that receives, processes, and exports telemetry data. It acts as a bridge between instrumented applications and backends like Prometheus or Grafana.
OTLP (OpenTelemetry Protocol)
OTLP (OpenTelemetry Protocol)
The default protocol used by OpenTelemetry to transport telemetry data between applications, collectors, and backends via gRPC or HTTP.
Pipeline
Pipeline
Defines how telemetry flows through the Collector. A pipeline typically chains together receivers, processors, and exporters for a given signal type (metrics, logs, or traces).
Processor
Processor
Handles data transformation inside the Collector, such as enriching signals with metadata, filtering unwanted data, batching messages, or enforcing sampling policies.
Prometheus
Prometheus
Our backend for storing and querying metrics. It supports powerful time-series queries (PromQL) and integrates with the OpenTelemetry Collector via remote write.
Receiver
Receiver
The component of the Collector that ingests incoming telemetry data. Supports formats like OTLP, Jaeger, Prometheus, and others.
SDK (Software Development Kit)
SDK (Software Development Kit)
A set of libraries you embed in your application code to produce telemetry signals like spans, counters, or logs.
Tempo
Tempo
Our backend for traces. It stores full distributed traces and integrates closely with Prometheus and Loki for seamless correlation in Grafana.
Terraform
Terraform
An Infrastructure as Code (IaC) tool we use to provision and manage cloud infrastructure, including the installation of observability components via Helm.